3 Density-independent growth in variable environments
Learning Objectives
From this lesson, you will…
- know how to quantify how temporal environmental variation affects population growth
- understand how spatial environmental variation affects population growth
- articulate the difference between the arithmetic mean and geometric mean and when/why they differ
- (begin to) appreciation why non-linearity is important in biological processes
- understand Jensen’s inequality
NOTE: if you’re reading this, it means this lesson is in the process of being updated. It should be complete soon!
3.1 Introduction
At the time of writing this lesson, the stock market has been quite volatile. There have been no shortage of opinions on the issue.
\(\qquad\) I’m not here to adjudicate politics or economic policy, but I care quite a bit about us getting the math right. So, politics aside, if you learn anything from this lesson, let it be this – that you instinctively understand who is wrong and who is right in this exchange:

What is this getting at? What do you think? As it turns out, this exchange broaches a fundamental concept in population ecology.
3.1.1 Okay, let’s talk about biology
Last lesson, we explored density-independent growth. A key assumption we made was that the rate of growth was constant (e.g. \(\lambda\) and/or \(r\) did not change with time or space). This is a massive simplification of nature.
\(\qquad\) In reality, natural communities are not static through time and space. For example, many plants experience a growing season – therefore, the population grows only certain times of the year. Similarly, plants experience good years and bad years due to annual variation in environmental conditions (e.g. inter-annual precipitation). Just as importantly, how a plant grows depends on where it is. Factors such as soil quality, moisture, and light levels vary in space.
\(\qquad\) Let’s use some concrete examples. Plants photosynthesis rate (e.g. Hydrilla verticillata) varies as a function of light intensity (irradiance):
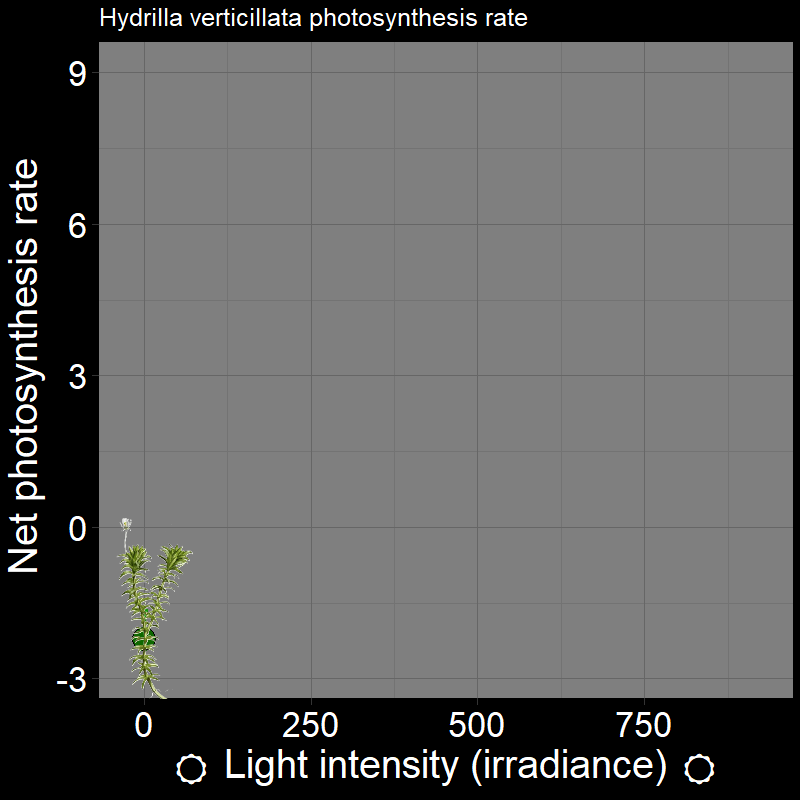
which, unsurprisingly, strongly affects plant growth. Light intensity varies in time (e.g. season) and space (i.e. if you’re plant in the under-story vs. the canopy of the forest).
\(\qquad\) Of course, this is not limited to plants. For example, ectothermic organisms (e.g. insects and reptiles, among many others) respond to temperature in very distinctive ways. Below are the following examples: the fecundity (births) of Synanthedon pictipes (a moth species; Figure 3.3A) and the sprint speed of the desert iguana (Figure 3.3B) respond to temperature in distinctive ways:
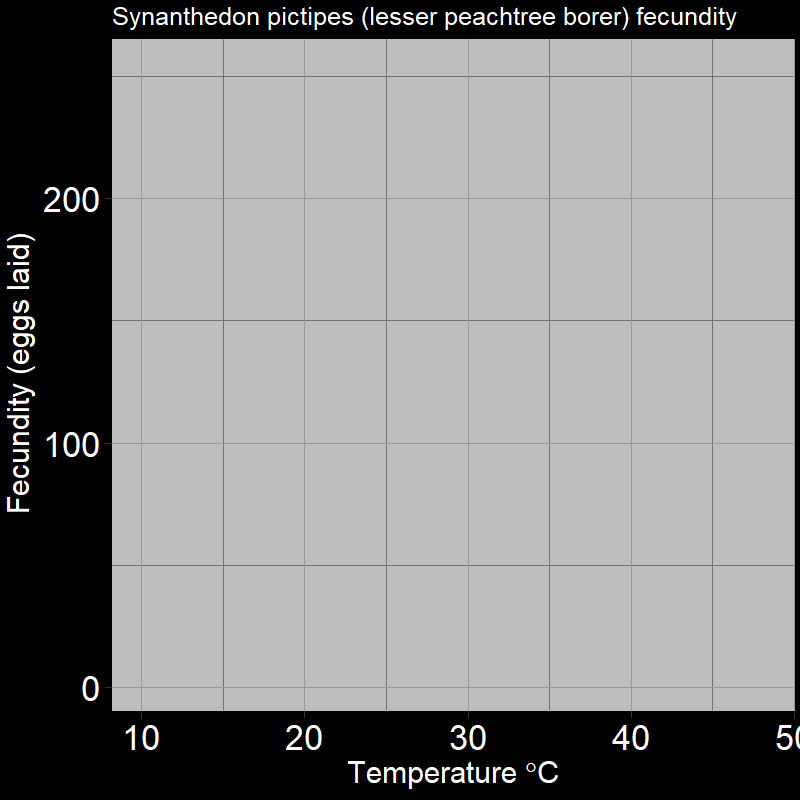
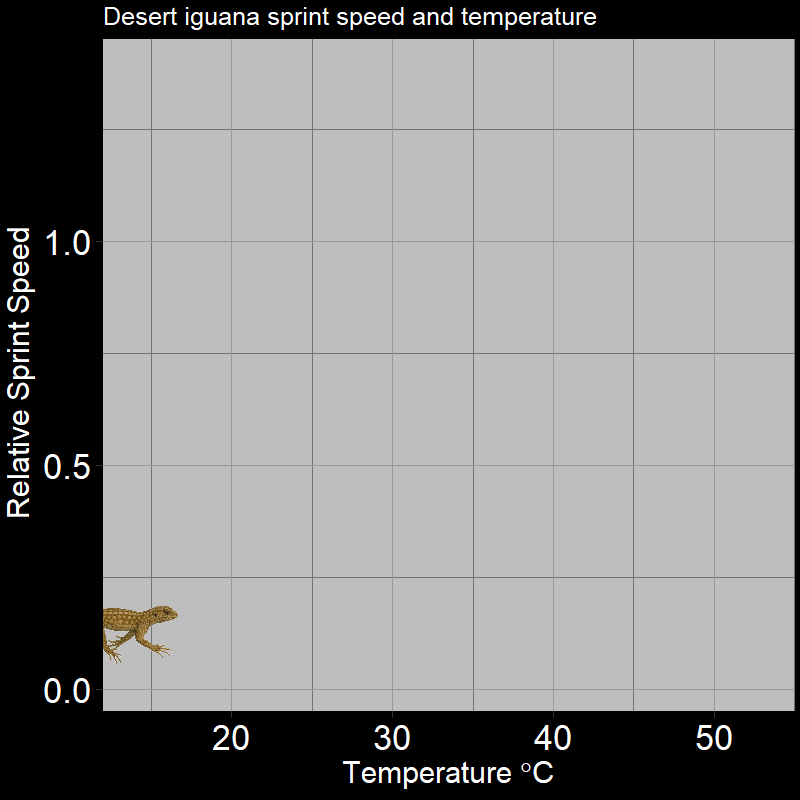
These are typical patterns. Factors such as seasonal temperature variation thus massively affect ectotherm activity and population growth.
\(\qquad\) An important feature is that how organisms respond to the environment is non-linear. Plant photosynthesis rate is a saturating response to light intensity; ectotherm’ responses to temperature are very “hump-shaped”. This is of great interest to a number of ecologists.
The key observations:
- The environment varies in time and space.
- The activities and vital rates of organisms respond to environmental variation, often in non-linear ways.
The key questions we will explore:
- How do spatial and temporal environmental heterogeneity affect population growth?
- How does the non-linearity of organisms responses to the environment regulate growth?
3.2 Growth in temporally variable environments
Like last lesson, we’ll start off with a question. This question is based on the modified version of the geometric population growth model from the previous chapter (so please review if you’re not familiar yet!).
\(\qquad\) Consider two populations, each starting with the same number of individuals. These populations live in a seasonal environment, with a “good” wet season and a “bad” dry season occurring every year, each lasting one unit of time (i.e. the time between \(t\) and \(t+1\)).
\(\qquad\) Population \(A\) is unaffected by season changes and grows with the same finite rate of increase \(\lambda\) each season: \(\lambda_{A}(\text{wet}) =\lambda_{A}(\text{dry}) = \lambda_A=1.5\). Thus, over all seasons:
\[ N_A(t+1) = \lambda_A N_A(t) \tag{3.1}\]
where time \(t\) indicates the season. One might consider population A “generalist”.
\(\qquad\) In contrast to population \(A\), the finite rate of increase of Population \(B\) is much larger during the wet season, (\(\lambda_{B}(t)= 10\) if wet) but grows poorly during the bad season (\(\lambda_{B}(t)=0.15\) if dry). From this we can write:
\[ N_B(t+1) = \lambda_B(t) N_B (t) \; \; \qquad \text{where } \; \lambda_B(t)= \begin{cases} 10 & \text{if } t \text{ is a wet season} \\ 0.15 & \text{if } t \text{ is a dry season} \end{cases} \tag{3.2}\]
With the above populations in mind:
Question 1: Which population, \(A\) or \(B\), will grow faster in the long-run? In other words, if we were to let the populations grow for a long time, which would have higher abundance?
If you got this right, congrats!
If you got this one wrong, you’re in good company: many students are inclined to guess population \(B\). However, a quick simulation shows this is not the case:
Below, we will explore why \(A\) grows faster than \(B\) and then derive some general intuition about the nature of population growth in variable environments.
To understand the result above, let’s review how geometric growth works.
\(\qquad\) I suspect a number of students get the above question wrong because they compare the average growth rate of each population (the \(\lambda\)s). For \(A\), the average is:
\[ \frac{\lambda_{A}(\text{wet})+\lambda_{A}(\text{dry})}{2}=\frac{1.5+1.5}{2}=1.5 \tag{3.3}\]
For \(B\), the average is
\[ \frac{\lambda_{B}(\text{wet})+\lambda_{B}(\text{dry})}{2}=\frac{10+0.15}{2}=5.075 \tag{3.4}\]
Since \(5.075 > 1.5\), it seems obvious to conclude that population \(B\) will grow faster. Where did this go wrong? If you got the question wrong (especially if you got it wrong for this reason), please take a moment to think it over.
\(\qquad\) As it turns out, taking the average/mean this way (called the arithmetic average/mean) is the wrong mean to take. To see this, lets first think about how each population grows each year. In following questions, we will consider how populations \(A\) and \(B\) grow.
Question 2: Let’s calculate what the population abundance of \(A\), \(N_A(t)\), will be after one year of growth. That is, what is \(N_A(2)\), assuming population \(A\) starts with one individual? Recall each unit of time is \(1\) season and each year consists of two seasons.
\[ N_A(2) = N_A(0)\times\lambda_{A}(\text{wet}) \times\lambda_{A}(\text{dry}) = 1\times 1.5 \times 1.5= 2.25 \tag{3.5}\]
(don’t pay too much attention to the fact that we are calculating that there will be a fraction of an individual… as mentioned in the previous lesson, one should interpret these types of equations as the “average” or “expected” growth of the population).
Now, let’s do the same thing for population B.
Question 3: Let’s calculate what the population abundance of \(B\), \(N_B(t)\), will be one after year of growth. What will \(N_B(2)\) be, assuming population \(B\) starts with one individual?
\[ N_B(2) = N_B(0)\times \lambda_{B}(\text{wet}) \times \lambda_{B}(\text{dry}) = 1 \times 10 \times 0.15 = 1.5 \tag{3.6}\]
Thus, \(N_A(2)> N_B(2)\) – as we already knew from the simulation, but it should be clear that population \(A\) grows faster.
\(\qquad\) Here’s an addition pair of simulations that you might find helpful for visualizing what is happening. For population \(A\):
and for population \(B\):
Or, to compare populations \(A\) and \(B\) again directly (adding an extra couple seasons):
The model I used for the above simulations is a stochastic model (i.e., it includes randomness). The specific model I used ensures there will always be a discrete number of individuals in the population (\(1,2,...,N\) individuals).
\(\qquad\) For example, in the first animation (population \(A\); \(\lambda=1.5\) every season), it is assumed \(\lambda = 1.5\) wherein \(\text{b} = 0.7\) and \(\text{d} = 0.2\). \(\text{b} = 0.7\) implies that, on average, each plant will produce \(0.7\) offspring each timestep. However, this is realized in the model in the follows way: on a given timestep, a plant may produce \(0\) offspring with probability \(p_0\), \(1\) offspring with probability \(p_1\), \(2\) offspring with probability \(p_2\), …, \(n\) offspring with probability \(p_n\). The values of the \(p\) terms such that the average number of offspring each adult produces is equal to \(0.7\). If you’re curious, I used a Poisson distribution. For \(\text{d} = 0.2\), the survival of an individual is a biased coin-flip each timestep.
\(\qquad\) I did this because animating e.g. producing \(0.7\) offspring doesn’t really work. Thus, this model is slightly different from what is presented above.
\(\qquad\) My hope is that this will help ease you into thinking about randomness / chance events – we will deal with it explicitly in a future lecture. I personally find thinking about chance events makes the models more intuitive. HOWEVER (as we will learn) mathematically dealing randomness with it is quite a bit more difficult. So, for now, we’ll stick with deterministic models!
Explore how tweaking the parameters affects the growth of populations A and B
In this interactive Shiny app, you can adjust the value of \(\lambda\) for each season for both populations \(A\) and \(B\).
Use this link, and go to module 3.1.
When comparing \(A\) with \(B\), what’s going on should start to become clear – the losses from when \(\lambda_{B}(\text{dry}) = 0.15\) are so severe, population growth is greatly slowed for population B relative to A.
\(\qquad\) What insights can we gleam from the fact that population A grows faster?
3.2.1 Geometric growth? Use the geometric mean!
In the previous lesson, we summarized geometric growth with the quantity \(\lambda\) – it basically told us everything we needed to know about the trajectory of population growth. This is not so simple now that \(\lambda\) varies over time. Like we did in the previous lesson, it would be nice to have a quantity that summarizes the long-term growth of the population (something equivalent to \(\lambda\) that accounts for the fact that \(\lambda\) varies with time).
\(\qquad\) Let’s derive one together.
As in the case of population \(A\), let’s assume the \(\lambda\) does not vary between seasons (the only growth rate is \(\lambda\)).
Question 4: Write the expression for \(N(t)\) starting with abundance \(N(0)\) at time \(0\). Assume \(t\) indexes seasons.
\[ N(t) = N(0)\lambda^{ t} \tag{3.7}\]
The above question should be review by now.
\(\qquad\) From the answer above, we can also derive \(\lambda\):
Question 5: For the non-varying \(\lambda\) case, we have: \[ N(t) = N(0) \lambda^t \] From this expression, write an expression for \(\lambda\).
First, divide each side by \(N(0)\): \[ \lambda^t = \frac{N(t)}{N(0)} \] and then take the \(t_{\text{th}}\) root: \[ \lambda = \bigg(\frac{N(t)}{N(0)}\bigg)^{1/t} \tag{3.8}\]
Recalling that \(\lambda\) quantifies the average growth per time-step.
This should also be review.
\(\qquad\) Recall that our goal is to derive a quantity that is equivalent to \(\lambda\) above for when “\(\lambda\)” is not constant over time. With the above questions in mind, let’s consider when \(\lambda\) changes with the season. As before, let’s assume each year has a good season and a bad season. Now, let’s write a similar expression for \(N(t)\) when the population experiences seasonal variation in the finite rate of increase, \(\lambda(t)\):
Question 6: A population experiences good wet seasons and bad dry seasons. The finite rate of increase of each season are given by \(\lambda(\text{wet})\) and \(\lambda(\text{dry})\). Write the expression for abundance \(N(t)\) after a total of \(t\) seasons. The population starts with initial abundance \(N(0)\). Assume an equal number of wet and dry seasons.
\[ N(t) = N(0) \cdot \big[\lambda(\text{wet}) \big ]^{t/2} \times \big[\lambda(\text{dry}) \big ]^{t/2} \tag{3.9}\]
The population experiences \(t/2\) wet seasons and \(t/2\) dry seasons. We might also write this as:
\[ N(t) = N(0) \cdot \big[\lambda(\text{wet}) \lambda(\text{dry}) \big ]^{t/2} \tag{3.10}\]
As a sanity check, see what happens when \(\lambda(\text{wet}) = \lambda(\text{dry}) = \lambda\).
\(\qquad\) With this in mind, can we derive something equivalent to \(\lambda\)? Recall in the non-variable \(\lambda\) case above, we derived \[ \lambda = \bigg(\frac{N(t)}{N(0)}\bigg)^{1/t} \tag{3.11}\]
Can you do something equivalent for our seasonally-varying \(\lambda(t)\)? Can you derive a quantity that summarizes the average growth per time-step (in this case, season)?
Question 7: For our seasonally varying \(\lambda\) case, we just derived:
\[ N(t) = N(0) \cdot \big[\lambda(\text{wet}) \lambda(\text{dry}) \big ]^{t/2} \tag{3.12}\]
From this expression, write an expression that summarizes the average growth per season. Use \(\lambda\) derived from the non-seasonally varying case
\[ \lambda = \bigg(\frac{N(t)}{N(0)}\bigg)^{1/t} \tag{3.13}\]
as a reference.
First, divide each side by \(N(0)\):
\[ \big[\lambda(\text{wet}) \lambda(\text{dry}) \big ]^{t/2} = \frac{N(t)}{N(0)} \tag{3.14}\]
and then take the \(t_{\text{th}}\) root:
\[ \big[\lambda(\text{wet}) \lambda(\text{dry}) \big ]^{1/2}= \bigg(\frac{N(t)}{N(0)}\bigg)^{1/t} \tag{3.15}\]
which we may choose to write as:
\[ \sqrt{\lambda(\text{wet}) \lambda(\text{dry}) }= \bigg(\frac{N(t)}{N(0)}\bigg)^{1/t} \tag{3.16}\]
Taking the above together, the equivalent to \(\lambda\) for the seasonally-varying case is \(\sqrt{\lambda(\text{wet}) \lambda(\text{dry}) }\). This might make some intuitive sense – for example, substitute \(\lambda(\text{wet}) = \lambda(\text{dry})\ = \lambda\), and see what you get.
Question 8: Consider the non-varying \(\lambda\) case and the seasonally varying case. If we were to assume:
\[
\frac{\lambda(\text{wet}) + \lambda(\text{dry})}{2} = \lambda
\] what would we be able to say about the average growth rates:
\[ \sqrt{\lambda(\text{wet}) \lambda(\text{dry}) } \; \; \; \; \text{vs}\; \; \; \; \lambda ?\] That is, can you say anything about the how large \(\frac{\lambda(\text{wet}) + \lambda(\text{dry})}{2}\) is vs. how large \(\sqrt{\lambda(\text{wet}) \lambda(\text{dry}) }\) is?
Check to see if you can prove if
\[ \frac{\lambda(\text{wet}) + \lambda(\text{dry})}{2} \geq \sqrt{\lambda(\text{wet}) \lambda(\text{dry}) } \]
Start with the expression
\[ 0 \leq \bigg(\lambda(\text{wet}) - \lambda(\text{dry})\bigg)^2 \] and expand things out.
This is a classic case of what is known as the “AM-GM” inequality. AM stands for “Arithmetic mean” and GM stands for “Geometric mean”. It states that arithmetic mean is always greater than or equal to the geometric mean (which we will define more properly below).
Using hint 2, we find
\[\begin{split} 0 & \leq \bigg(\lambda(\text{wet}) - \lambda(\text{dry})\bigg)^2 \\ & \leq \lambda(\text{wet})^2 + \lambda(\text{dry})^2 - 2 \lambda(\text{wet}) \lambda(\text{dry}) \\ & \leq \lambda(\text{wet})^2 + \lambda(\text{dry})^2 + 2 \lambda(\text{wet}) \lambda(\text{dry}) - 4 \lambda(\text{wet}) \lambda(\text{dry}) \\ & \leq \bigg(\lambda(\text{wet}) + \lambda(\text{dry})\bigg)^2 - 4 \lambda(\text{wet}) \lambda(\text{dry}) \end{split}\]from which, we can rearrange to
\[ \bigg(\lambda(\text{wet}) + \lambda(\text{dry})\bigg)^2 \geq 4 \lambda(\text{wet}) \lambda(\text{dry}) \]
Now, if you take the square root and dividing each side by \(2\), we get:
\[ \lambda= \frac{\lambda(\text{wet}) + \lambda(\text{dry})}{2} \geq \sqrt{\lambda(\text{wet}) \lambda(\text{dry}) } \]
\(\qquad\) This result has some profound implications for population growth, including our starting question in Figure 3.1.
Question 9: Under what condition does
\[ \lambda= \frac{\lambda(\text{wet}) + \lambda(\text{dry})}{2} = \sqrt{\lambda(\text{wet}) \lambda(\text{dry}) } \]
\[ \frac{\lambda(\text{wet}) + \lambda(\text{dry})}{2} = \sqrt{\lambda(\text{wet}) \lambda(\text{dry}) } \] when
\[ \lambda(\text{wet}) = \lambda(\text{dry}) \]
Here, I want you to ask yourself: “how does temporal variation in the finite rate of increase affect the average growth rate generally?”.
\(\qquad\) Now, let’s try to generalize growth rate beyond the seasonal example we gave. We might imagine we have a different \(\lambda\) every season. That is, we have \(\lambda(1)\) on season \(1\), \(\lambda(2)\) on season \(2\), …, \(\lambda(t)\) on season \(t\).
Question 10: Write the expression for abundance \(N(t)\) after \(t\) seasons, occurring over \(t/2\) years starting with abundance \(N(0)\). \(\lambda\) changes every year (\(\lambda(1)\), \(\lambda(2)\), …, \(\lambda(t)\)).
\[ N(t) = N(0) \times \lambda(1) \times \lambda(2) \cdots \lambda(t) \] That is, we need the product of all \(\lambda\)’s. This can be written like this:
\[ N(t) = N(0) \prod_{k=1}^t\lambda(k) \tag{3.17}\]
where \(\prod\) is the so-called product symbol, and indicates the product all the \(\lambda\)s between times \(k=1\) and \(k=t\).
Now, let’s again follows the steps from above:
Question 11: Recall again the the expression non-varying \(\lambda\): \[ N(t) = N(0) \lambda^t \] From this expression, we derived an expression for \(\lambda\). Write the equivalent expression for \(\lambda\) for
\[ N(t) = N(0) \prod_{k=1}^t\lambda(k) \tag{3.18}\]
Like we did in the “two-season” case, use the expression
\[ \lambda = \bigg(\frac{N(t)}{N(0)}\bigg)^{1/t} \]
as a reference.
First, divide each side by \(N(0)\):
\[ \prod_{k=1}^t\lambda(k) = \frac{N(t)}{N(0)} \tag{3.19}\]
and then take the \(t_{\text{th}}\) root:
\[ \left(\prod_{k=1}^t\lambda_k \right)^{1/t} = \bigg(\frac{N(t)}{N(0)}\bigg)^{1/t} \tag{3.20}\]
This value – the \(t_\text{th}\) root of the product of \(t\) quantities – is called the geometric mean (see details below).
3.2.2 Let’s summarize what we’ve learned!
As noted above, the first (and incorrect) analysis calculates the arithmetic mean of \(\lambda\) for each of populations \(A\) and \(B\). This is the type of average you might be used to: you take the sum of elements and divide by the number of elements, or
\[ \text{arithmetic mean of } \lambda \text{ over } n \text{ years} = \frac{\lambda_1+\lambda_2+ \cdots + \lambda_t}{t} = \frac{1}{t}\sum_{k=1}^t\lambda_k \tag{3.21}\]
But let’s think about how our population grows. As we noted earlier,
\[ N(t) = N(0) \, \cdot \, \lambda(1) \, \lambda(2) \cdots \lambda(t) \tag{3.22}\]
over the long-run, the average growth per time-step is given by the so-called “geometric mean”:
\[ \text{geometric mean of } \lambda \text{ over time } t = \left(\lambda_1 \times \lambda_2 \times \cdots \times \lambda_t\right)^{\frac{1}{t}} = \left(\prod_{k=1}^t \lambda_k\right)^{\frac{1}{t}} \tag{3.23}\]
In the case of in a variable environment, as we explored above, it is the geometric mean that determines growth.
How does variation in \(\lambda\) affect the population growth rate?
In this interactive Shiny app, you will explore the consequences of changing the amount of temporal variation in growth \(\lambda\) while keeping the arithmetic mean of \(\lambda\) constant.
Use this link, and go to module 3.2.
Question 12 Let us imagine a population grows geometrically over time \(t\), experiencing growth rates \(\lambda_1\), \(\lambda_2\), …, \(\lambda_t\). Under what circumstances would the arithmetic mean give the same average growth rate as the geometric mean?
Think about modifying the values of the \(\lambda\)s. Under what assumption about both \(\lambda\)’s is it true that \(\frac{\lambda_1 + \lambda_2}{2} = \sqrt{\lambda_1 \times \lambda_2}\)?
which there is no variation in \(\lambda\), that is
\[ \lambda_1 = \lambda_2 = ... = \lambda_t \]
\(\qquad\) Now, let’s answer the question we started with:
Question 13 Consider again Figure 3.1. Who is right? Is it Majestic lion? Or are incredulous Owl and Thinking Cat correct?
The Majestic lion is right! The situation is as follows. We start with an initial amount of money, \(M\). Then, \(M\) decreases by \(10 \%\):
\[ M \rightarrow 0.9\, M \] After this, the \(m\) increases by \(10 \%\) in value:
\[ 0.9\, M \rightarrow 0.9 \times 1.1\, M = 0.99 \,M \] Obviously, \(0.99M < M\).
While the above conversation was about the stock market, it’s an application of what we were talking about above. The arithmetic mean of the finite rate of increase of \(M\) is
\[ \text{arithmetic mean of } \lambda_M = \frac{0.9 + 1.1}{2} = 1 \] However,
\[ \text{geometric mean of } \lambda_M = \sqrt{0.9 \times 1.1} \approx 0.995 \] Thus, fluctations (even if they fluctuate up and down by the a fixed percentage) will result in a decrease.
3.2.3 Bet hedging part I
Perhaps you’ve heard the idiom “don’t put all your eggs in one basket”. Here, we will consider this idiom from the perspective of an annual plant population.
\(\qquad\) Let’s start with the question: “if you’re a seed, should you germinate and grow into an adult as fast as you can?”. To answer this question, let’s come up with a model (as biologists sometimes do).
\(\qquad\) Let’s imagine a model with the following properties:
- Seeds persist in the soil.
- Each timestep, each seed germinates with probability \(\text{g}\).
- If a seed germinates, it turns into a reproductive adult that timestep. If it is a “good” year, it produces seeds; if it is a bad year, it does not produce seeds
- A reproductive adult always dies after germination and (potentially) reproducing (i.e., during the same timestep).
\(\qquad\) The model is a little different from what we previously analyzed – here we only need to keep track of seeds. It’s a little bit like the first model we examined in the previous lesson (in which we assumed adults produce seeds which immediately turn into adults – the same idea, but in reverse).
\(\qquad\)Mathematically, we can represent this as:
\[ \underbrace{S(t+1)}_{\begin{array}{c}\text{Seeds at} \\ \text{next time step}\end{array}} = \underbrace{(1-\text{g}) \, S(t)}_{\begin{array}{c}\text{Seeds that} \\ \text{don't germinate}\end{array}} + \underbrace{\text{b}(t) \times \text{g} \, S(t)}_{\begin{array}{c}\text{Seeds that germinate} \\ \text{and reproduce}\end{array}} \tag{3.24}\]
where \(\text{b}(t)\) is the time-varying number of seeds that the plant produces
\[ \text{b}(t) = \begin{cases} \text{b}_\text{Good} & \text{if } t \text{ is a good year} \\ 0 & \text{if } t \text{ is a bad year} \end{cases} \tag{3.25}\]
\(\text{b}_\text{Good}>0\). In addition, we can define \(P_G\) as the probability of a good year:
\[ 0 \leq P_G \leq 1 \]
\(\qquad\)We may also rewrite the model like this:
\[ S(t+1) = S(t) \big( \, 1+ \text{g} \, \text{b}(t) -\text{g} \big) \tag{3.26}\]
which should look familiar to you!
Question 14A: Imagine there are no bad years (a prospect I’m envious of). That is, let’s assume \(\text{b}(t) = \text{b}_\text{Good}\) for all \(t\). In this case, our model above is essentially a special case of the discrete-time stage structured model from the previous lesson (equation 2.22). What is this special case?
Translate “all adults die after reproducing” into equation 2.22 from the previous lesson.
It is the special case of equation 2.22 in which
\[ \text{d} =1 \]
i.e., adults always die.
Note that there is a subtle difference in the model of equation 2.22 and the above model with respect to when reproduction happens. Try to articulate to yourself what that difference is.
Question 14B: if there are no bad years (\(P_G=1\)), what value of \(\text{g}\) would maximize growth? Assume the population is growing.
We actually answered this question in the previous lesson in our analysis of equation 2.22, (except we didn’t assume \(\text{d} =1\).)
Also, you must assume \(\text{b}(t) = \text{b}_\text{Good} > 1\), otherwise the population cannot grow (i.e., growth requires $ - >0$).
As we have explored in the past
$$ =
$$
For our model, this gives:
\[\frac{S(t+1)}{S(t)} = \lambda = 1 + \text{g} \, \big( \, \text{b} - 1\big) \] which will always increase with \(\text{g}\) unless \(\text{b}<1\). Of course, if \(\text{b}<1\), then the population will decrease anyway.
Thus, if there are no bad year, \(\text{g}=1\) (always germinating) maximizes growth.
With the above in mind, let’s explore what happens with \(b(t)\) is not constant over time! As we will explore, how often good years occur affects the value of \(\text{g}\) that maximizes growth.
Bet Hedging (Part 1)
In this interactive Shiny app, you will investigate how
Use this link, and go to module 3.3.
3.2.4 Temporal variation in the intrinsic rate of increase \(r\)
TBA
3.3 Nonlinear averaging and fluctuations: Jensen’s inequality
TBA
3.4 Environmental variation in \(\lambda\)
TBA
3.5 References
TBA